Tips for analysing your competitors and benchmarking your service
No matter what stage of scale your business is at, it is important to maintain a living competitor analysis process. Finding market fit is an important early phase for most businesses and this will likely mean that new competitors will appear on your horizons quite regularly. Then as you move into market fit, new competitors will enter the market you’re serving.
Both of these positions have their advantages. Those looking for market fit haven’t yet established deep roots and so tend to be able to pivot with more agility, whilst more established products may not need to be as proactive but if a disruptor appears, find it harder to react.
This article aims to guide you through conducting different competitor analysis activities and outlines the potential insights you can expect to gain.
Get to know your own product
It may be that you’ve recently joined the business and you’ve got some internal digging to do to understand the now, next and later for the products you’re going to use to compare against.
If the product is already live in any sort of form the best place to start is looking under the hood at any existing data. How are your customers using the product? Where are the drop offs? What devices are most prominent? These sorts of questions will help you focus on your next step.
Now you know where you should focus, do an in depth page by page screenshot of your key journeys. Bring them into a whiteboard tool such as Miro and lay them out.
Title each key step with a post-it note ready for some analytical activities.
Establish your targets
The next step is to understand which similar products you’d like to analyse. You can collate your target list through mixing various methods.
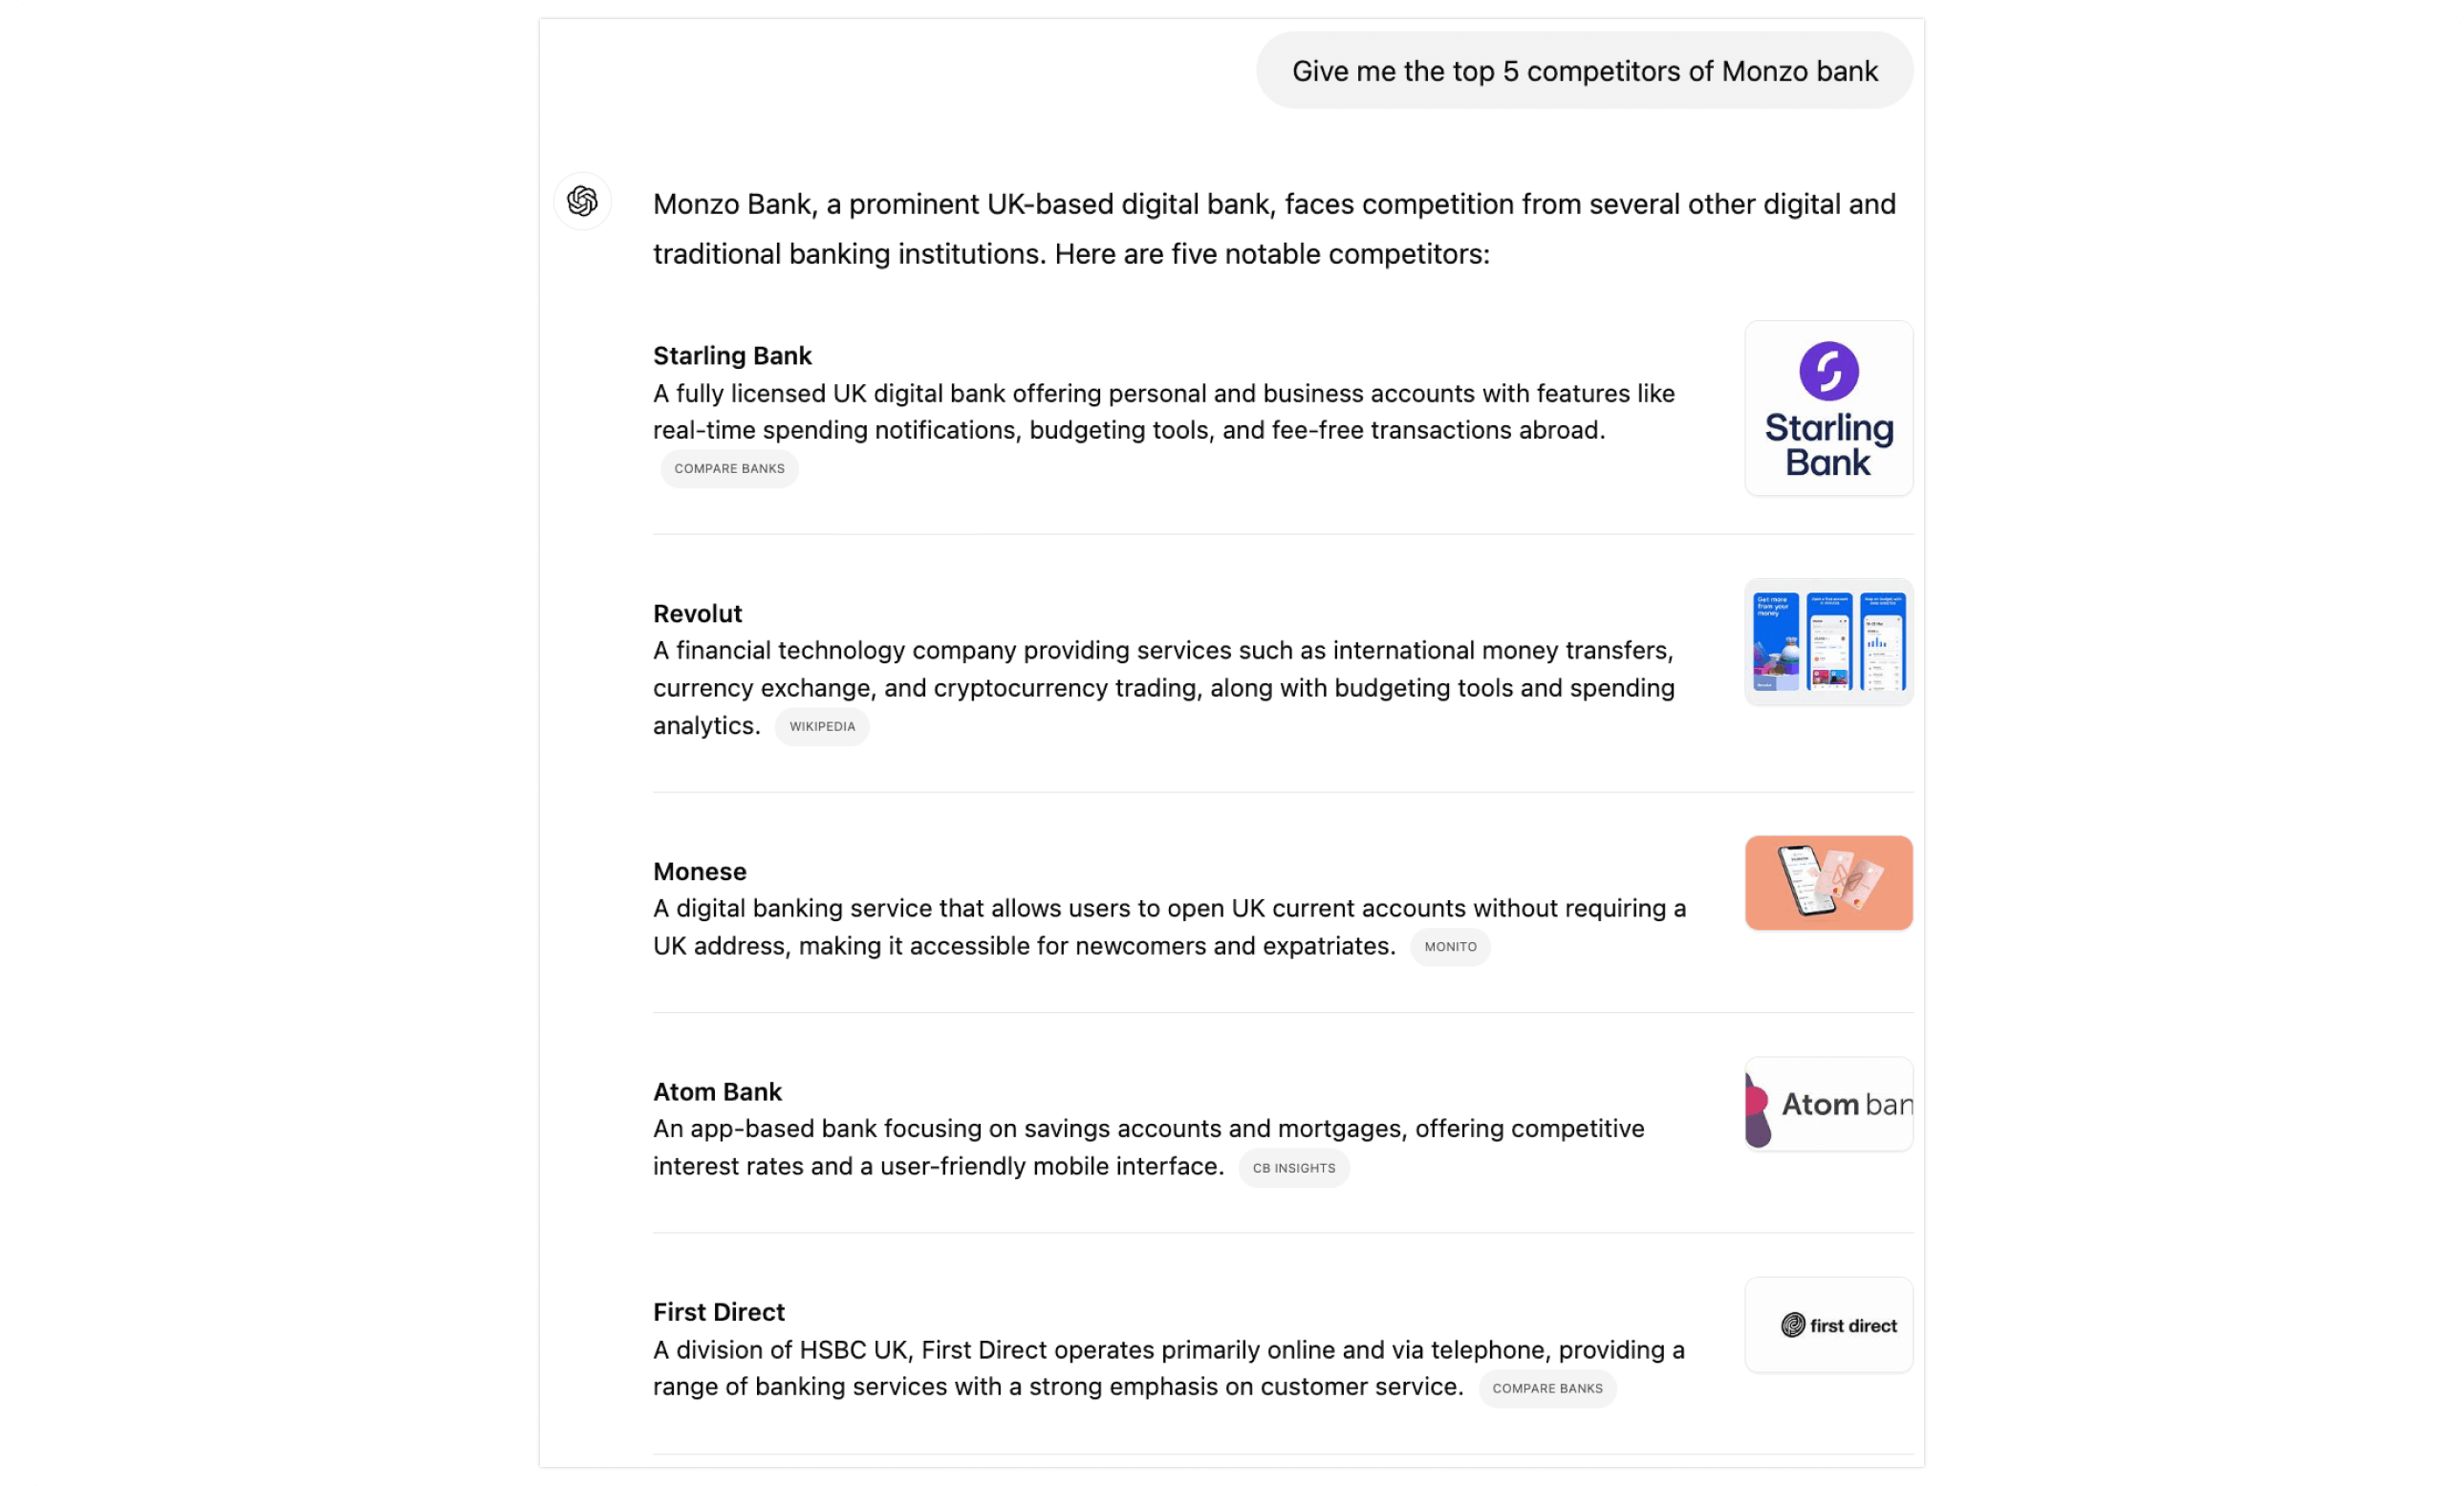
If you’re new to the subject matter, start by asking an AI chatbot for the top 5 - 10 competitors to your brand. Although some caution should be applied here as AI chatbots do ‘hallucinate’ (no really!) based on their programming to build in variance, it’s a great starting point to give you a list to validate. If the list that comes back isn’t specific enough don’t forget you can continue to prompt a chatbot to get more specific if you find that useful.

Take your starting list and validate this internally with existing SMEs (subject matter experts). There is likely to be people in the business who are already living and breathing the subject, even if it’s the founder!
Once you’re confident in your competitor list, go through the same flows as you did with your brand, laying out the screen shots so they roughly line up with the same journey steps.
Now you’re ready to do some analysis!
Qualitative analysis
Qualitative analysis is the process of examining non-numerical data to understand underlying concepts, opinions, or experiences. In this case we’re going to use a simple workshopping technique to identify the strengths and opportunities in your existing product. You can run this process by yourself, or with a group either synchronously or asynchronously.
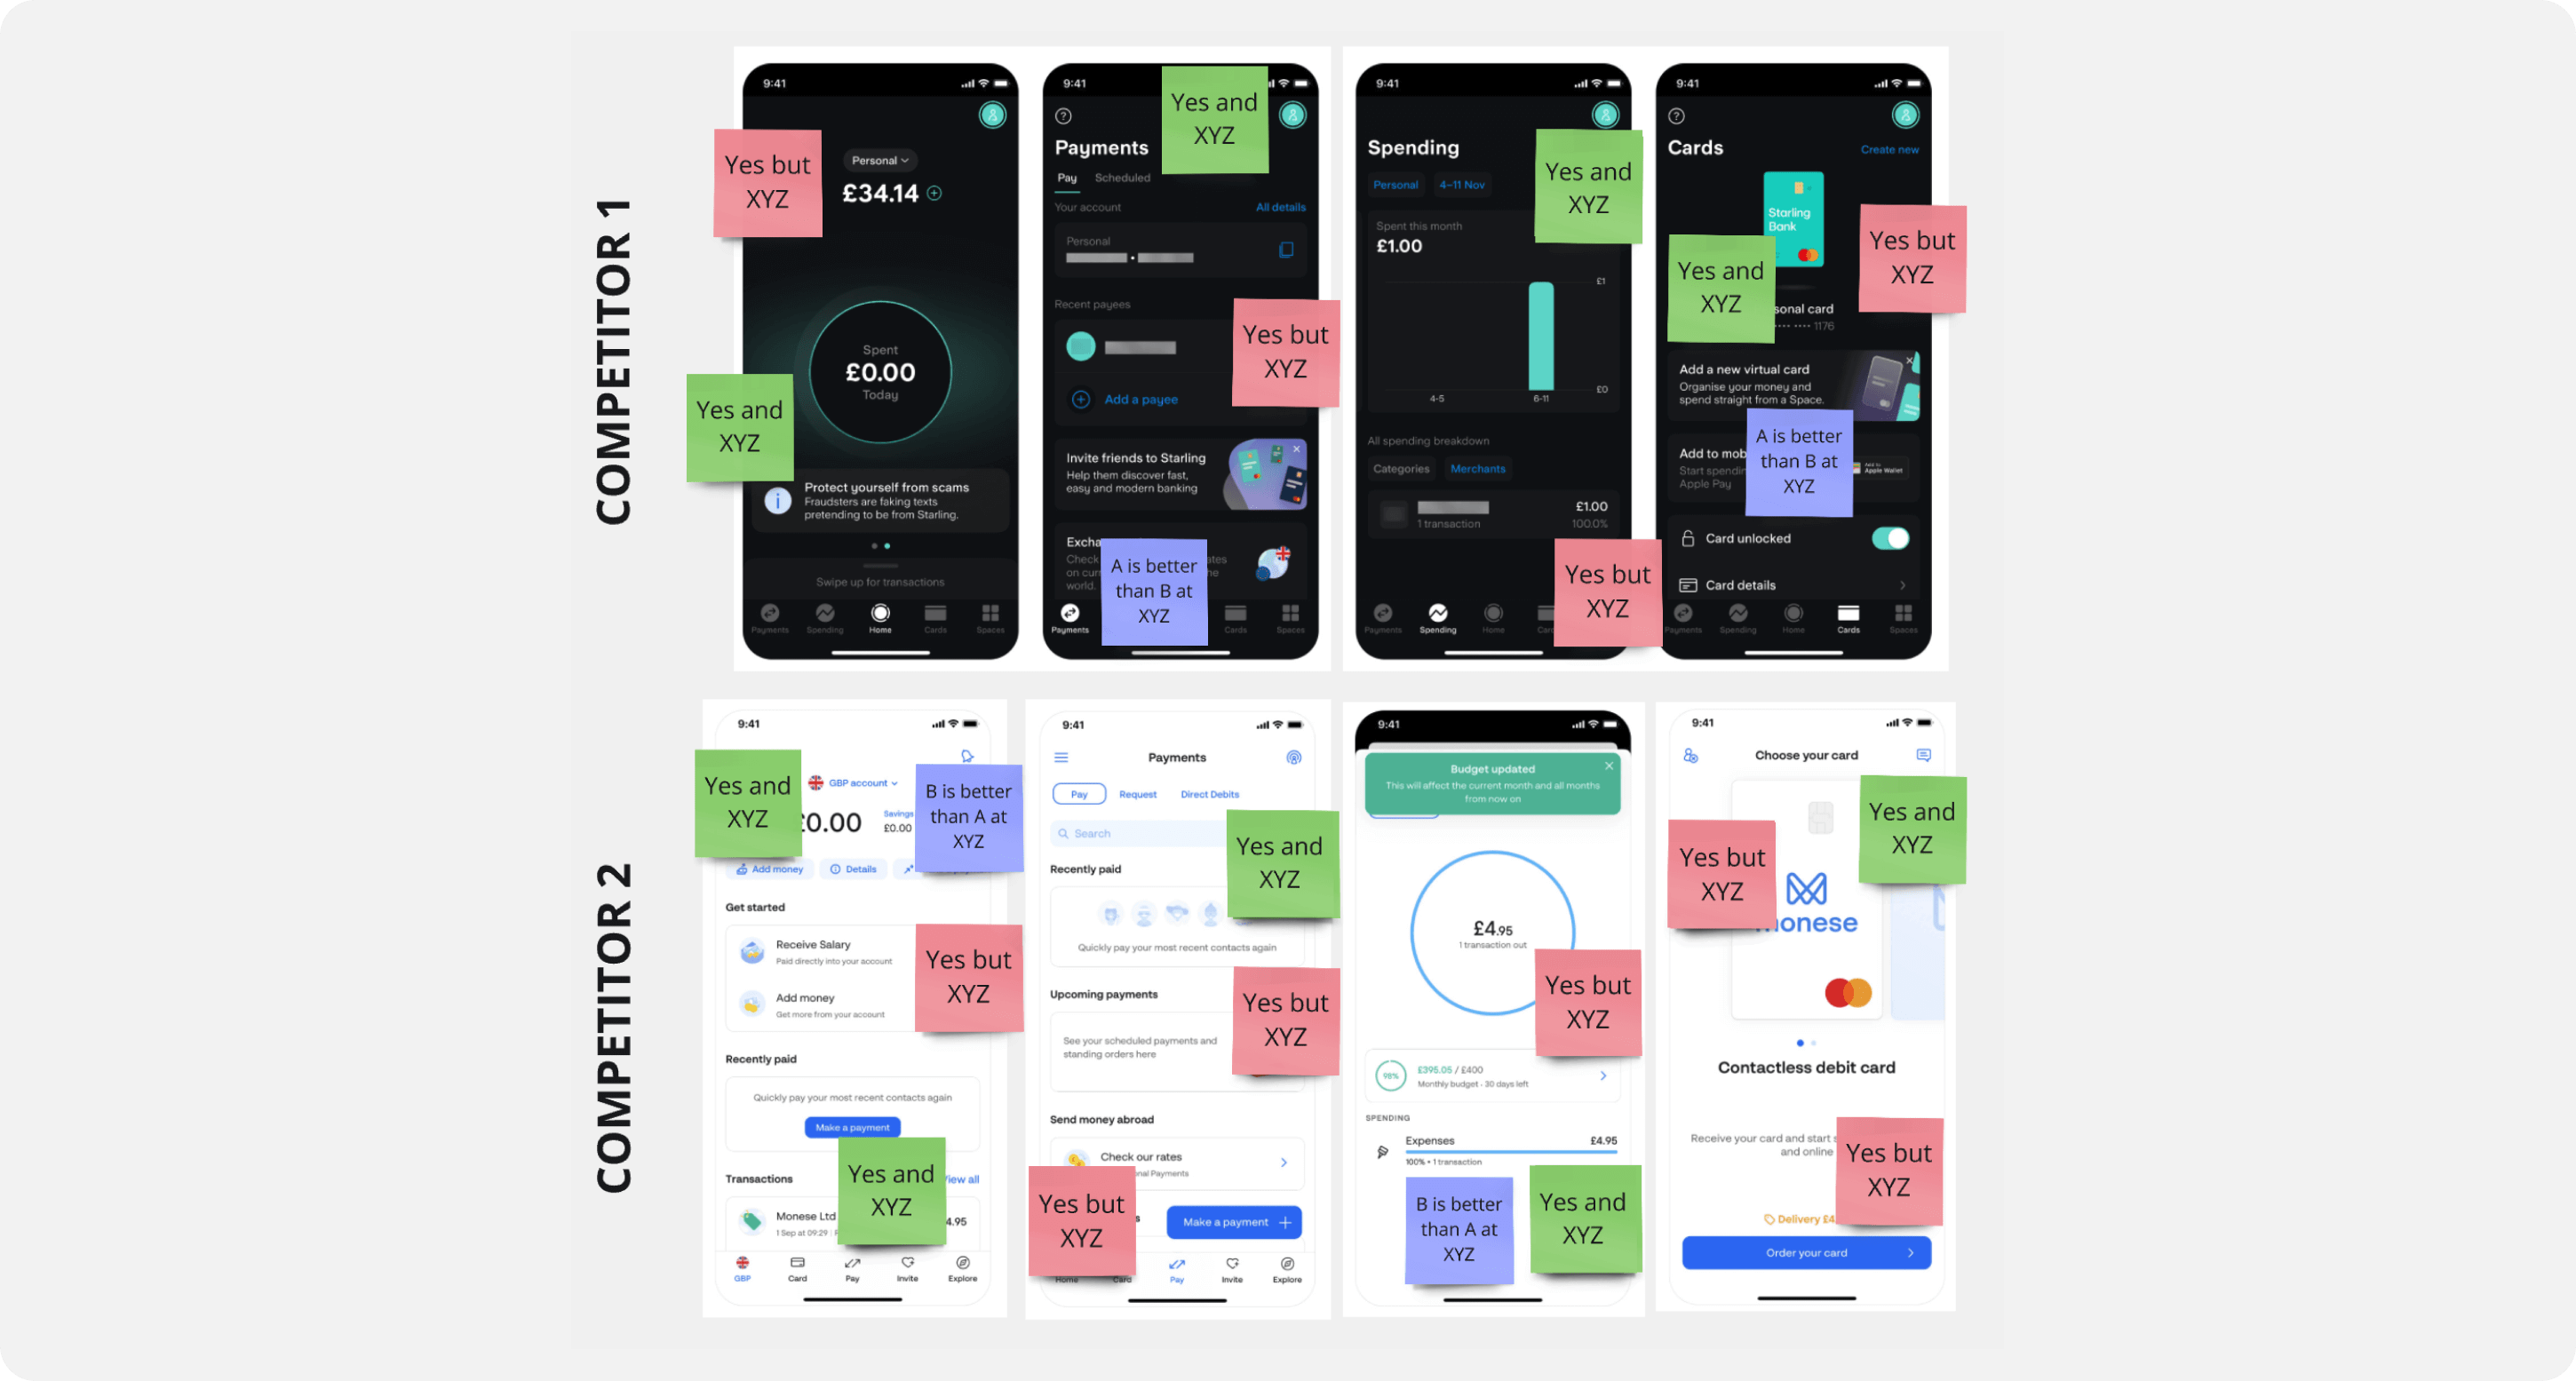
Gather a bunch of green post-it notes and begin each one with ‘Yes and…’. Use this statement to call out all the things on each page of your product or service that you think are positive or strong. This is likely to be mainly based on subjectivity bolstered by any expert insights you’ve started to gather.
Here is an example: “Yes and this supporting information banner is really helpful because (product x) can be hard to understand by some of our users”
Gather a bunch of red post-it notes and begin each one with ‘Yes but…’. Use this statement to call out all the things on each page of your product or service that you think have room for improvement or could directly be having a negative impact on the usability.
Here is an example: “Yes but this part of the application is very misleading because it could be interpreted as x when in fact it is y”
Once you’ve analysed your own product / service, do the same with the 5-10 competitors you've mapped out. Optionally you can go more detailed at this point with your analysis by not only noting their strengths and challenges, but also you can add in direct comparison post-its with a new colour.
Here is an example: “Y does a better job of flagging missing data than we do”

Quantitative analysis
Quantitative analysis is a method that focuses on using numerical data to understand, interpret, and predict patterns. In this case we’re going to look at a few simple benchmarking techniques to give even deeper insights into where your product or service sits in the mix.
Count the number of (x) it takes for your product or service to get from (a to z)
Here is an example:
‘Number of pages to get through the checkout.’ Or ‘Number of data artefacts requested from the user within the checkout.’
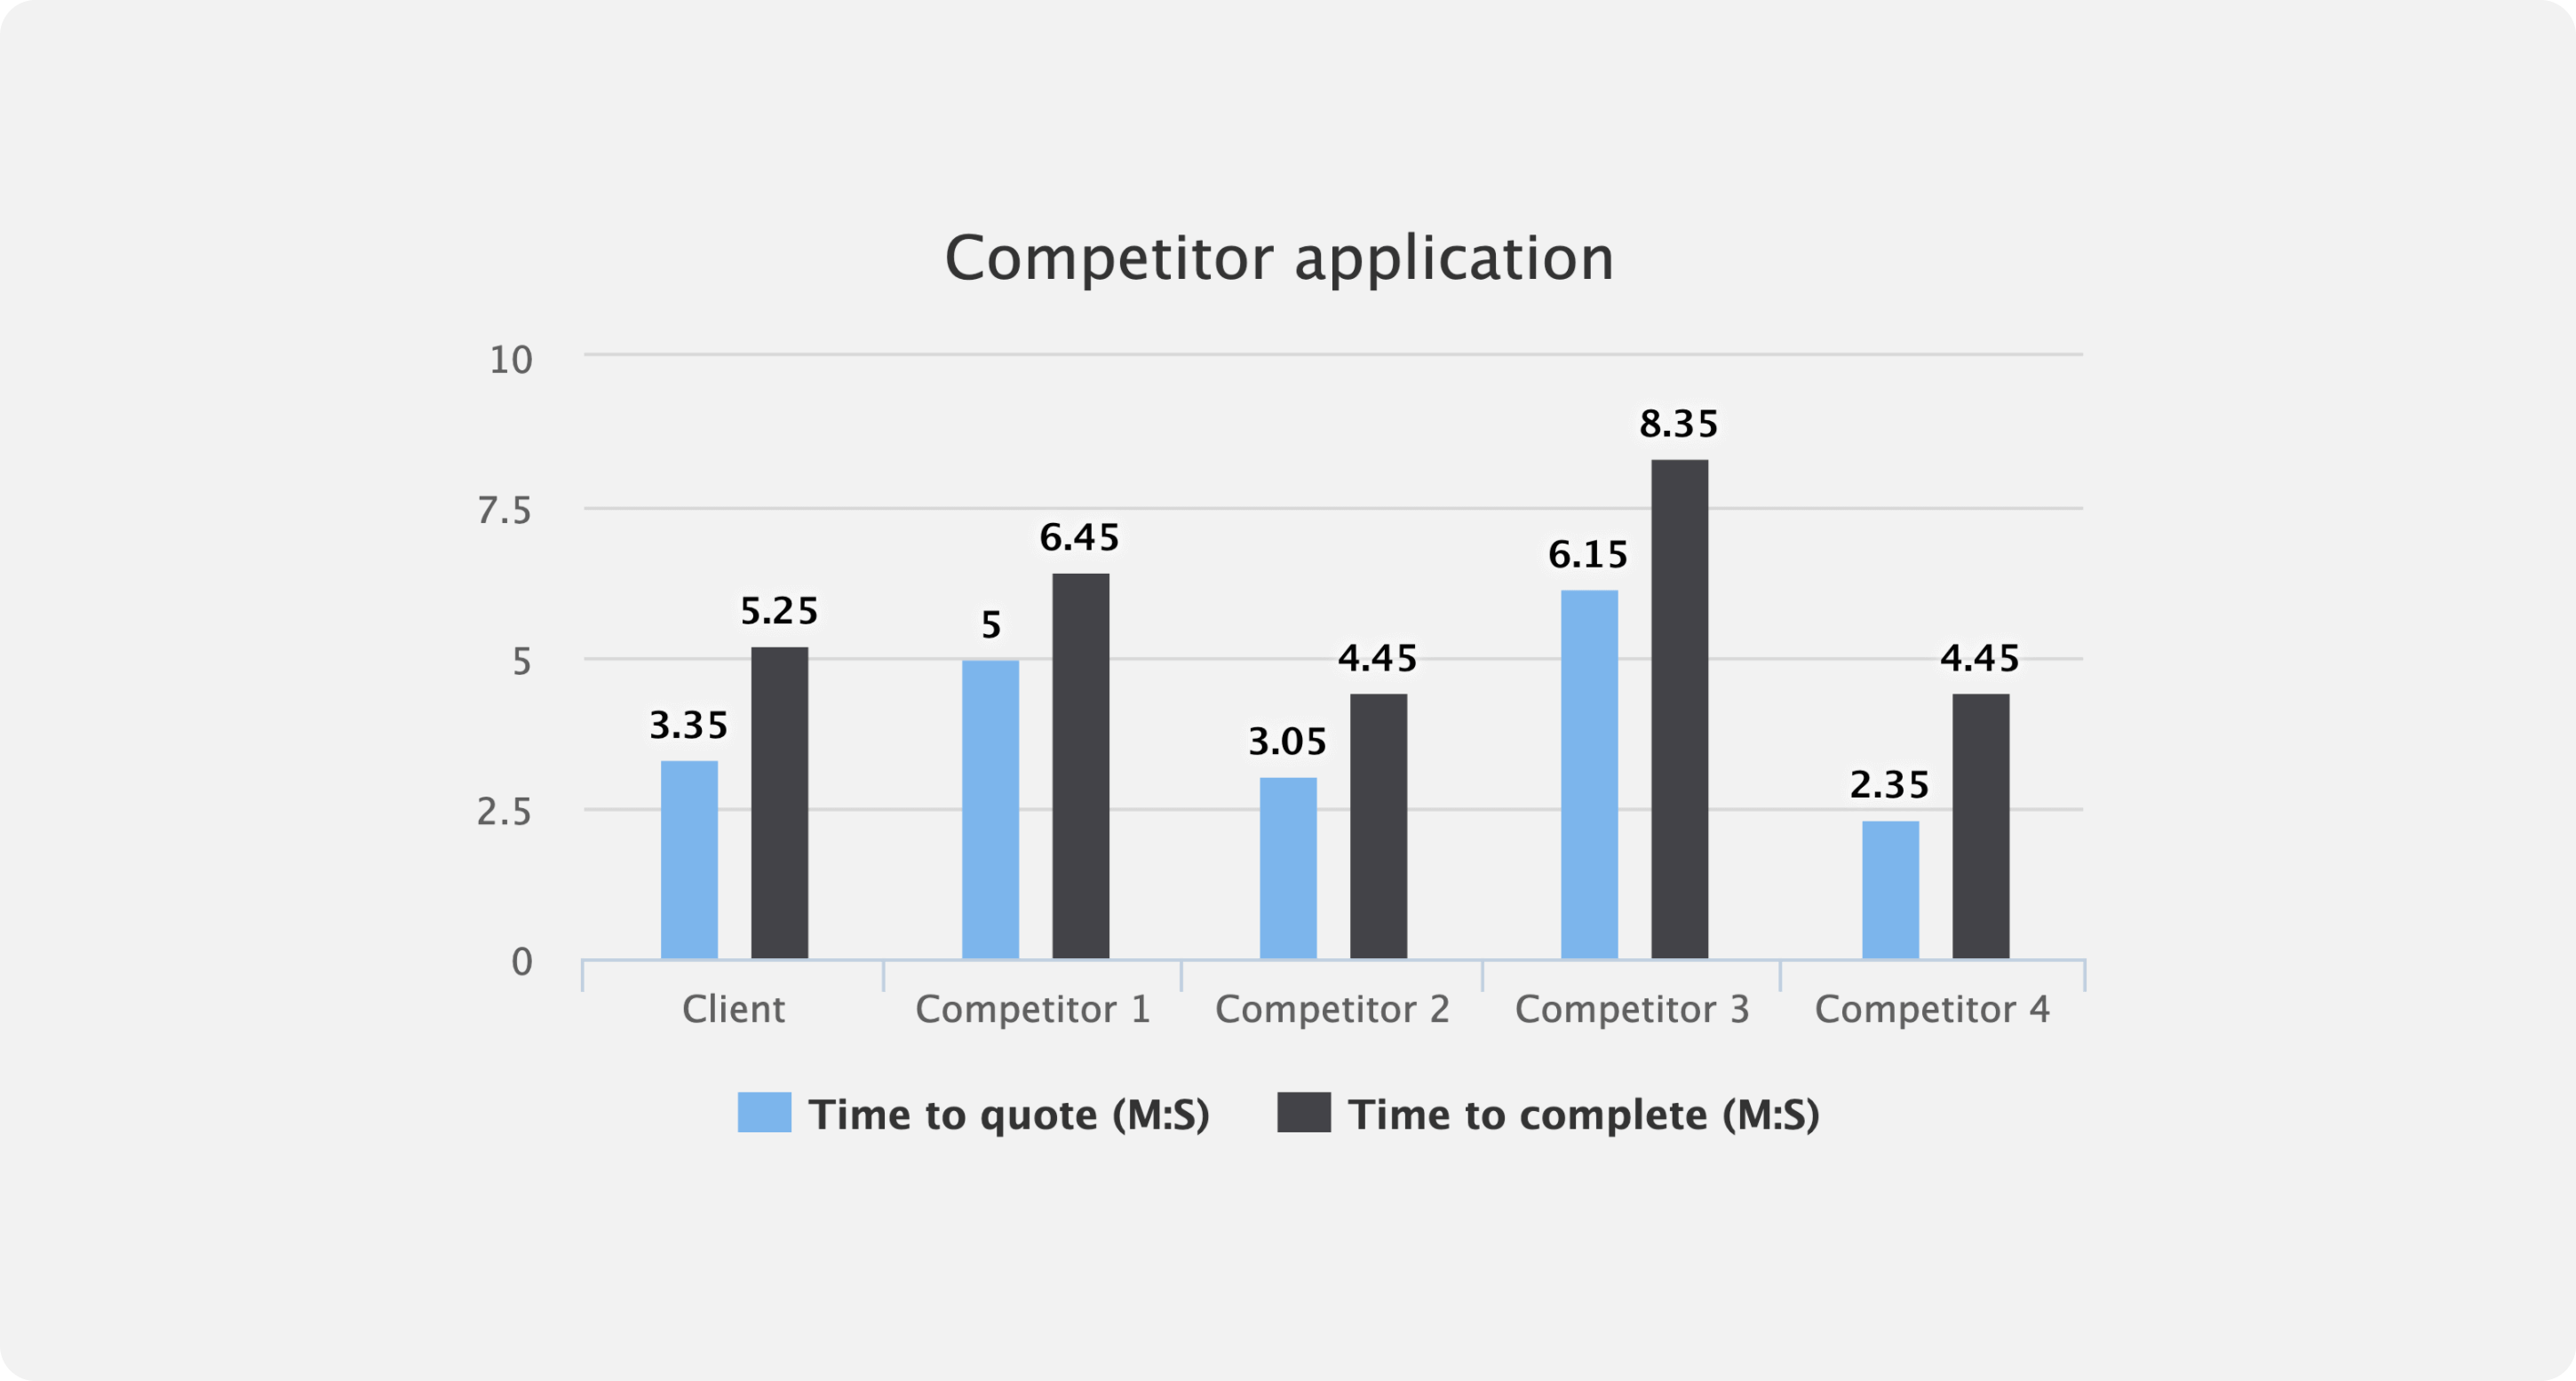
The Important thing here is you count the same aspect of each competitor. Now use any simple data visualisation tool you like. Below ive used the 'charts' function directly in Miro to map both during a recent exercise on a client.

Measure the time it takes to get from (a to b) and optionally from (c to d) and so on. You may have a number of key checkpoints throughout your journey that are worth focussing on. And when it comes to human interaction, time is indeed money so getting the balance of collecting the right amount of data vs getting the user through a process efficiently is key.
There are two methods you could use to measure this. The obvious is literally timing yourself with a clock. Of course you shouldn't do this during the screenshot stage as this will artificially inflate any realistic usage patterns, so you’d have to go back through each competitor again to time them, trying to remove bias and curveballs like field auto-fills etc.
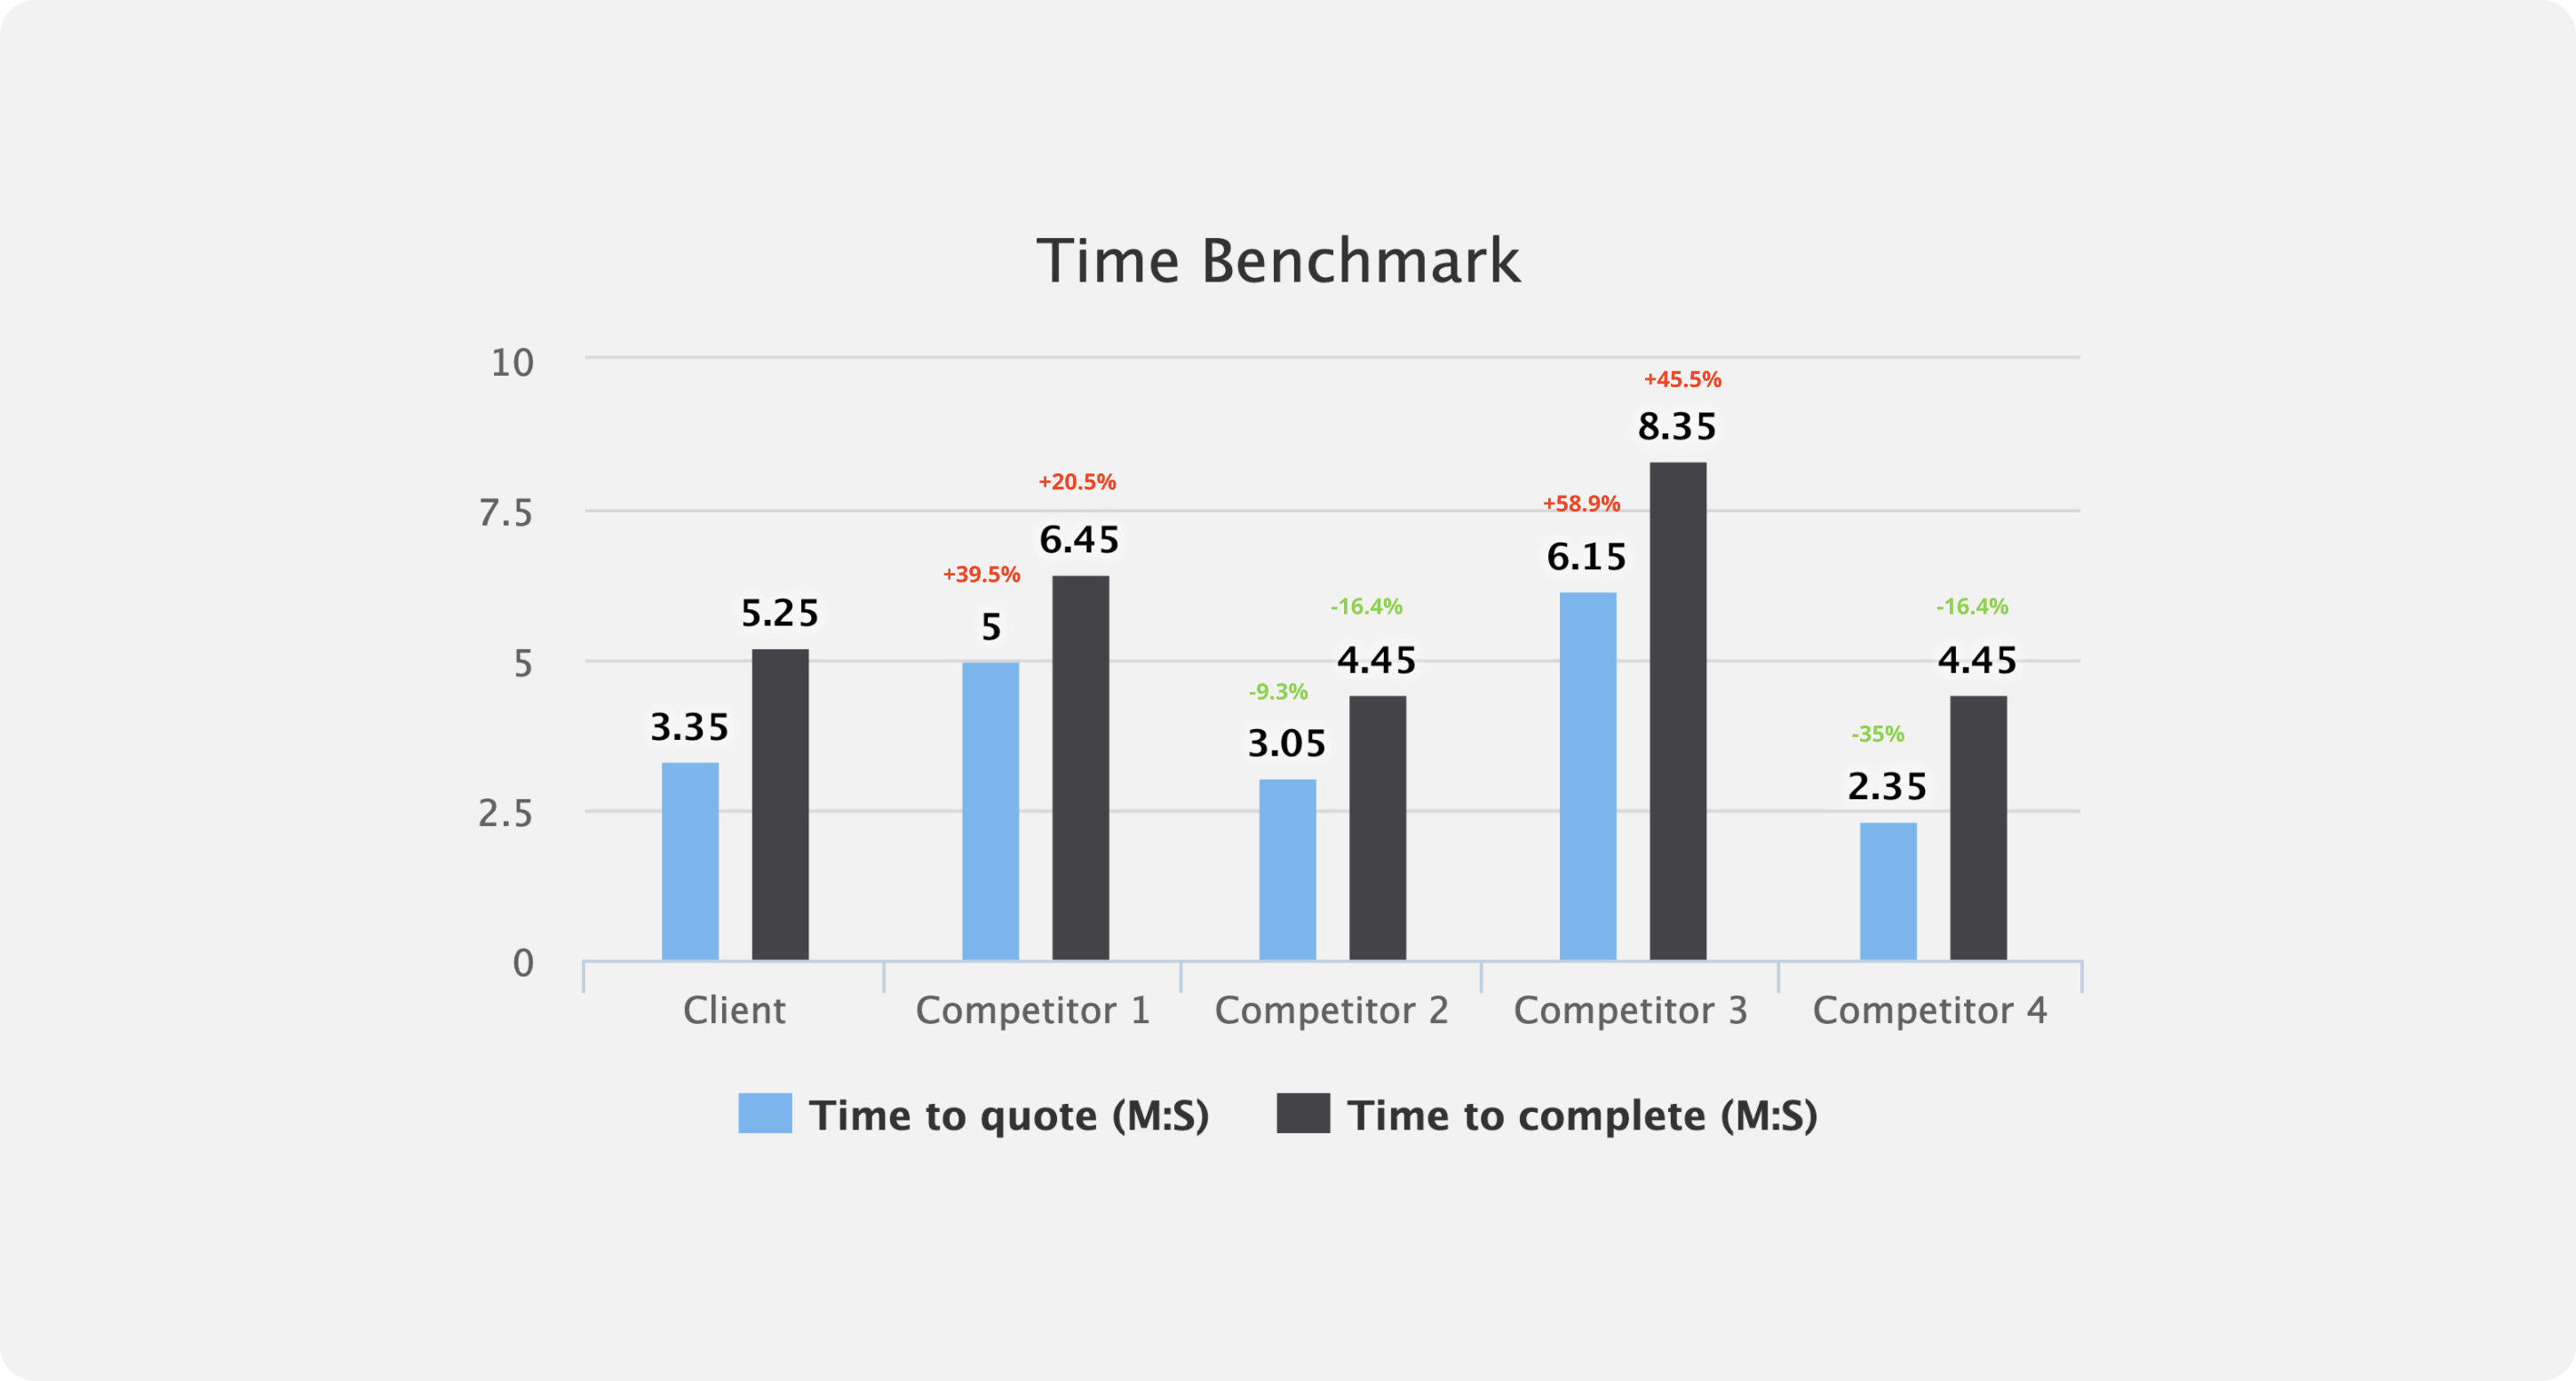
Below I decided to take an alternative approach. I applied an arbitrary amount of time to four different types of UI throughout each funnel, then I used tally counting to add each one up.
- Select data = 5 seconds
- Type data = 10 seconds
- Read short text = 10 seconds
- Read long text = 20 seconds
Then finally I used my GCSE math skills to work out the relative difference from the client.

Why are both these activities useful?
With this combined qualitative and quantitative insight, you now have the foundations for various really powerful discovery activities to help you understand, frame and ideate on your product or service challenges.
The north star here is to revisit this process every 6-12 months using the same techniques. Doing so will give you and the business an idea of progress and value.

